Chart
About
![]()
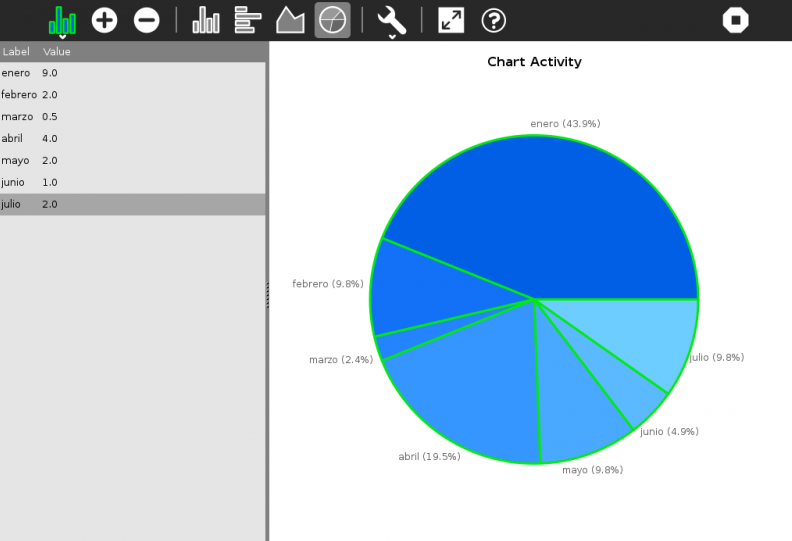
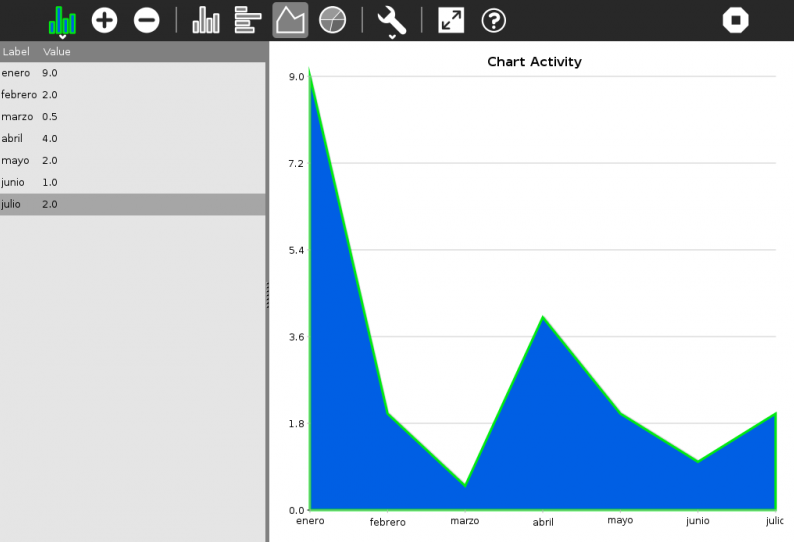
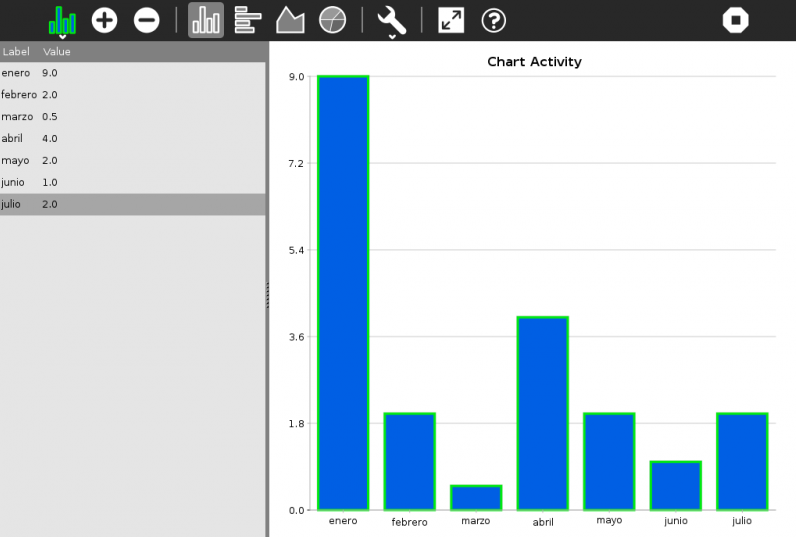
Chart lets you do graphical representation of simple tabular data, in the form “label: value”. It can draw Horizontal/Vertical bar charts, line charts and pie charts.

Where to get Chart
Chart activity is available for download from the Sugar Activity Library: Chart
The source code is available on GitHub.
Using chart
Basic Usage
First you need to add data to create the graph
- You can add data with
 button
- ... or remove data wih
 button
To change the graph title, just change the activity title
Next, you can change the type of the graph
- Vertical Bars

- Horizontal Bars

- Lines

- Pie

Configs
You can change the colors or the horizontal and vertical labels in the configs toolbar 
 Icon.
Icon.
Development
- Chart uses PyCHA library
Ideas for future releases
- Show a help tutorial when activity is started from scratch
- Share, edit the data with your friends
Where to report problems
Please report bugs and make feature requests at chart/issues.
You may also send an e-mail to aguz@sugarlabs.org