StarChart
About
 This activity will display a map of the sky showing the position of the visible stars, some of the larger and brighter deep-sky objects (DSOs), the “classical” planets, the sun and the moon.
You may specify a location (longitude and latitude) and the time (including time zone offset from GMT) that you wish to have a plot for. Alternatively, you can get a plot which is updated once a minute showing the current sky.
You can also learn your way around the sky by using the “Locate” feature to find an object whose name you know or by using the “Identify” feature to get the name of something you see on the chart.
If you have access to a small telescope or a pair of binoculars, StarChart can provide a magnified view encompassing 7 degrees of the sky centered on a point you specify.
The latest version (StarChart 16) can be downloaded from here.
Introduction
StarChart was created by a professional programmer and amateur astronomer who likes to vacation in places far removed from his home town and appreciates the opportunity to view the sky from these places. The XO is a wonderful travel accessory for supporting this sort of thing since it is light, compact and frugal of battery power while providing a reasonably large, reasonably high resolution color display.
This Activity is intended to support the star-gazer who has no instrument better than his own eyes. It can be used as a guide to the sky overhead, as a tool for planning future observations (including observations from a different location) or as a way to reprise the look of the sky as it was at some time in the past.
Using Star Chart
Before you begin
Be sure your XO has been set to the correct time-zone offset and the correct local time! The astronomical algorithms need to compute GMT (UT) and can’t do that if “now” isn’t the right time. (This is only an issue if you don’t plan to always use “specify time”. But it’s still an untidy way to operate your computer.)
Installation and set-up
For best results, remove any previous version of StarChart you may have installed. Re-start X (hit Ctrl-Alt-Backspace). Then, simply follow the usual procedure for downloading and installing an Extra Activity.
Once you have installed StarChart, start it and select the clock button.

Is the time (YYYY/MM/DD,HH:MM) the correct year, month, day, hour and minute for your location (it’s 24-hour time – 1:00 PM is 13:00 in that system)? Is the zone offset showing the correct hours and minutes that your locale is offset from GMT? (Hint: Eastern Standard Time in the USA is “-5:00” with respect to GMT.) If not, stop the activity and correct your time and time-zone using the Sugar control panel before proceeding.
If the time and date are correct, the chart will be displaying the sky for a location in Massachusetts, USA as of right now. If you don’t happen to be in that location, you will need to enter your longitude and latitude. Click on “where” to display the controls for doing this. You should be able to get your coordinates from any good map, Google Earth or simply use the published coordinates for any relatively nearby city or town. Another possibility is from a site on the internet such as http://www.mapquest.com/atlas which provides a map with latitude and longitude information from which you can interpolate your specific coordinates.
Don’t be obsessive about the precision for this: the star chart will not look noticibly different if you are wrong by one or two degrees either way in latitude or longitude. Being off 100 km won’t make enough of a difference to show. But be sure you select East or West longitude and North or South latitude! Then click “Ok” so the program knows you really want to change these settings.
Now I’d recommend clicking the “Make Home” button. StarChart will save this location as your “home” position. From now on, whenever you start the activity the location will default to these coordinates.
How to read the plot
Stars are drawn (with default settings of the “What” menu tab controls) as white dots of different sizes. The brightest stars are drawn as the biggest dots; the dimmest stars are drawn as the smallest dots.
The constellations are drawn as white lines forming the stick-figures defined by the International Astronomical Union.
The sun, moon and “classical” planets are drawn as their astrological symbols and plotted much larger than they actually appear.
Deep sky objects are plotted as areas of gray, with different “decorations”, depending on the type of the object.
- A diffuse nebula (such as the one in Orion) is plotted as a gray rectangle.
- A galaxy is plotted as a gray ellipse or circle with a white border.
- A planetary nebula is plotted as a gray circle with a central white dot.
- An open cluster is plotted as a gray circle with no border.
- A globular cluster is plotted as a gray circle with a white border and a central dot.
Although the ellipse representing a galaxy is roughly the correct eccentricity, the orientation of the ellipse on the chart is arbitrary and does not reflect the galaxy’s actual position angle.
To identify symbols, you can correlate them to the Astronomical Symbols on Wikipedia
Operating Instructions
The initial display for StarChart will show the sky for your locale and the current time. (This assumes you have done the steps described above in “Installation and set-up”.)
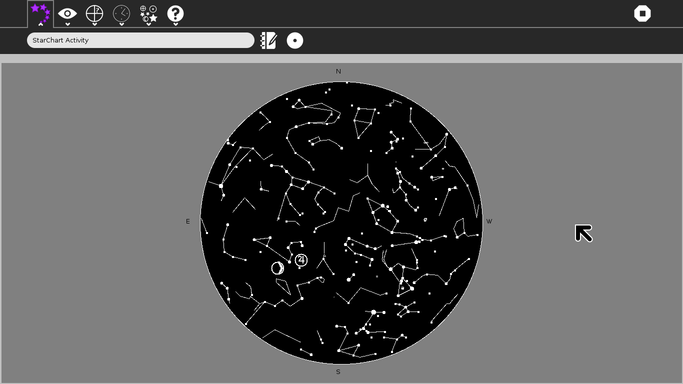
Menu

(We will go from left to right)
 is for changing the appearance. For exapmle, it lets you change the color combinations of the map and decide how many stars you want to see and if you want the constellation figures. These settings get saved, too. So if you prefer black stars on white sky you can get that combination. Let’s walk through each option and see what it does to the appearance of the map.
Things you can do
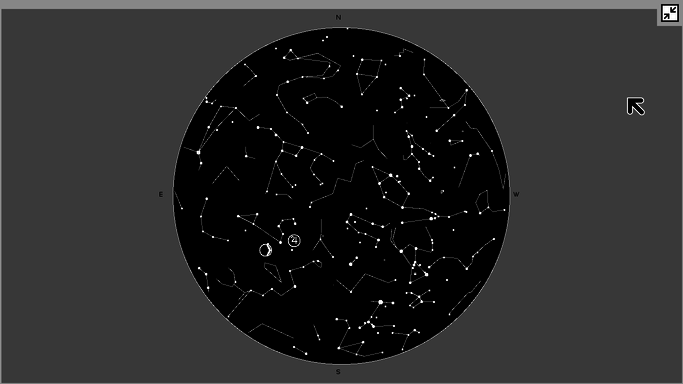
- Toggle Full-Screen
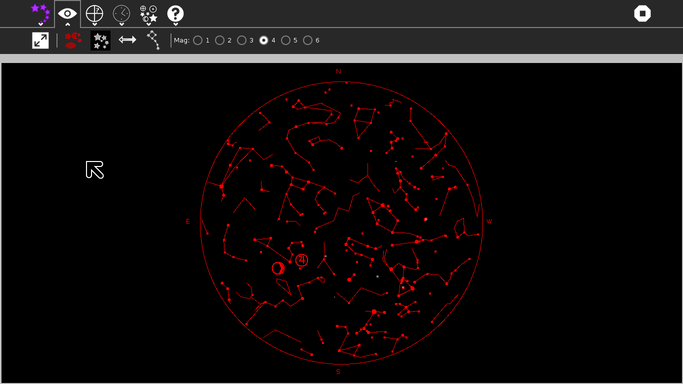
- Toggle Night Vision
The “Night Vision” option makes the activity’s display mostly red on black. Red light doesn’t affect your night vision so using this mode lets your eyes read the map and still remain sensitive enough to see the dim stars. Hint: it also helps to set the brightness of the back-light as low as you can and still read the chart to minimize the effect on your night vision.
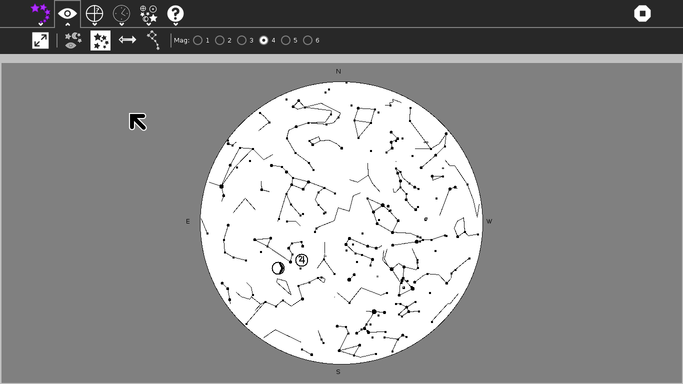
- Invert Display
But sometimes you will find it easier to work with a chart that’s black on white like a page in a book. This mode is not good for use at night but it’s fine in a classroom or in daylight. To get a black chart on a white background, set “Invert Display”.
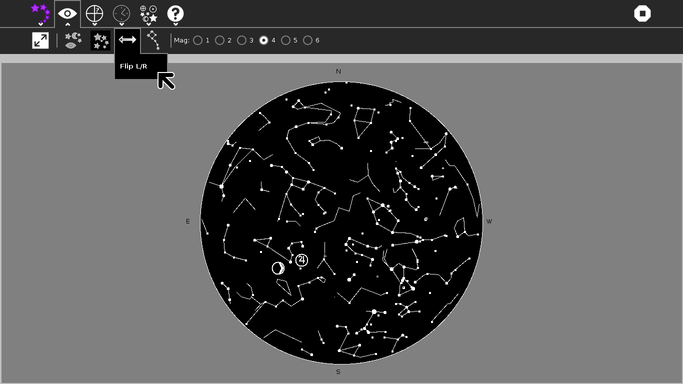
- Flip L/R
Normally, StarChart shows its map with east on the left. This may seem odd to you because a terrestrial map would show east on the right. But if you face east and hold the map so that east is near the ground, you’ll discover that with a terrestrial map, north on the map is now to your south! With StarChart’s mirrored map, north is north and south is south when east is down. That means what you see on your XO’s screen will match what you see in the sky.
But if you find it confusing to have east on the left and west on the right, you can set “Flip L/R” and get the map to be like a terrestrial map.
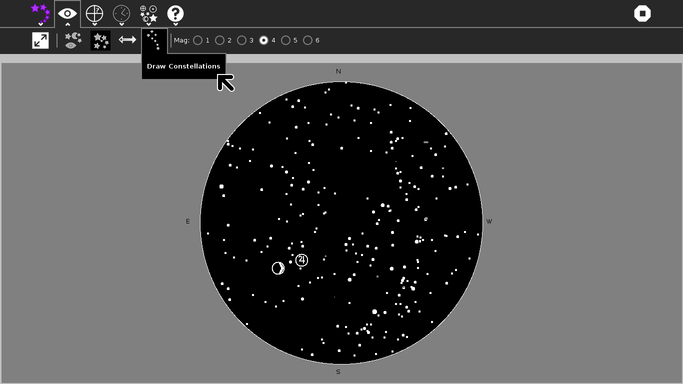
- Draw Constellations
Stars are grouped in imaginary figures called constellations. These represented scientific and navigational instruments, gods and goddesses, mythical and real animals and other patterns that people saw in the sky. Since drawing detailed pictures would make the chart too confusing, astronomers usually draw simple stick-figures. StarChart normally plots these standard figures. But you can turn that off and just see the stars themselves if you want – after all, there are no lines drawn in the sky!
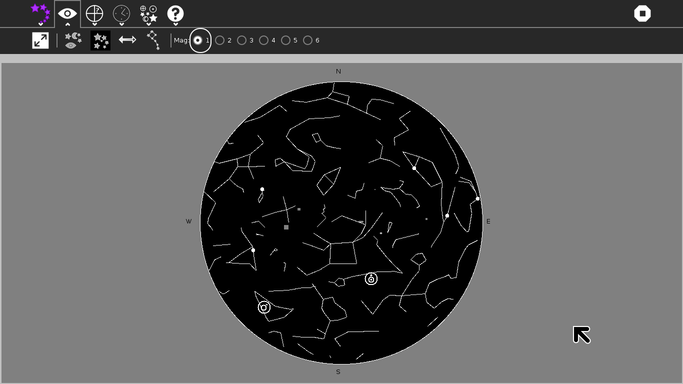
- Change magnitude level (Choose between 1 to 6)
Stars come in different brightnesses. Astronomers call these levels of brightness “magnitudes”. The brightest stars are magnitude zero (well, in a couple of cases, brighter than that); the dimmest stars that you can see without a telescope or binoculars on a really dark night will be about magnitude 6.
There are a lot more dim stars than bright ones. So if StarChart always plotted all the stars you could see, there would be so many (over 1,000!) that it would be hard for you to read the map. So there’s a control (actually six of them) that lets you select how dim the stars the activity should bother to plot. StarChart defaults to plotting stars of magnitude 4 or brighter. This is a good compromise between having not enough stars to appreciate what the sky looks like and having so many that it’s confusing. This brightness is about what you would see on an average night in suburban locations.
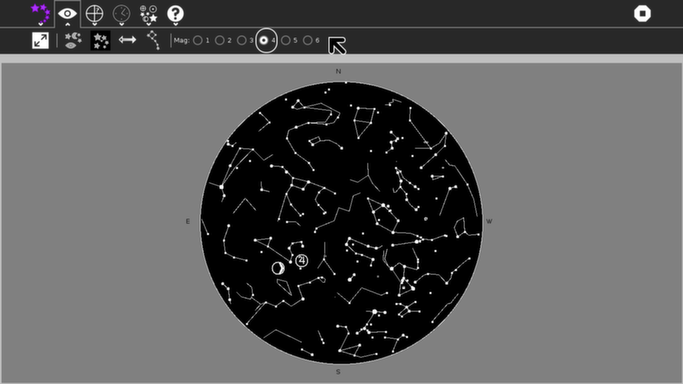
Here is what the plot looks like when you have asked for only the brightest of the stars. This is what the sky might look like from the middle of a large city. (magnitude level 1)
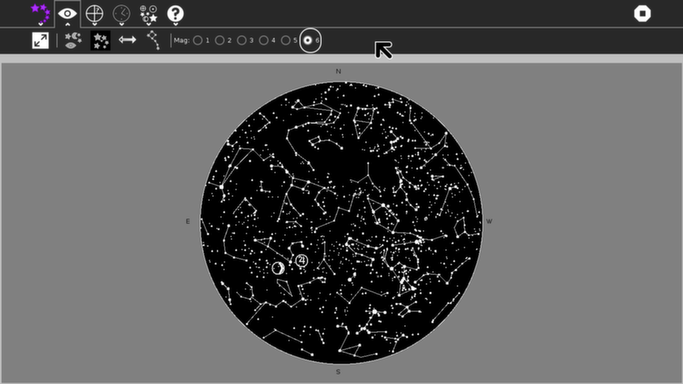
And this is what the sky might look like from a mountain a long way from cities or towns on a moonless night. (magnitude level 6)
(magnitude level 4)
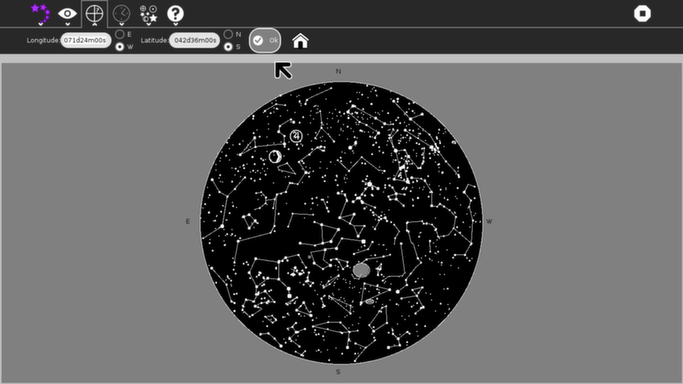
Where  (Specify Location)
This is the menu tab that lets you tell StarChart from what place on earth you would like to see the sky plotted. Usually, this would be where you are, but sometimes you might want to see what the sky looks like to someone living elsewhere.
A location on earth is specified by longitude and latitude. Longitudes go from zero to 180 degrees east or from zero to 180 degrees west. Latitudes go from zero to 90 degrees north or zero to 90 degrees south.
The StarChart activity will accept an angle as a number of degrees, including fractional degrees (like “123.45”) or an angle as degrees, minutes and seconds. In this second type of angle, you must use a form like “123d27m33s”. Enter longitude (be sure to select east or west) and latitude (be sure to select north or south) and click on the “Ok” button. If the new location is substantially distant from the old, the star map will look very different.
The “Make Home” button will set the selected location as your default observatory coordinates. This setting is then remembered for all future StarChart sessions.
When  (Specify Time)
These controls let you specify the time for which you want the chart plotted.
Normally, “Now” is selected and the current year, month, day, hour and minute and the number of hours and minutes that your time-zone differs from GMT by is shown in the time and offset fields. Additionally, the time field will automatically be updated to track the current local time and the plot will automatically be recomputed once a minute. In this mode, the plot will match the current sky and will move over time the way the sky does. But you can also use these controls to specify that you want a chart for a particular time in the future or past.
Click the “Specify time” radio button, since “Now” isn’t what you want anymore. Now specify the new time, beginning with the year. Time is entered as a four-digit year, a two-digit month and a two-digit day, separated by slash (/) characters, a comma (,) and then the hour and minute in 24-hour time separated by a colon (:). Example: 2008/02/20,22:00 would be 10 PM on the 20th of February, 2008. Next, if your location observes daylight time, you may need to add or subtract an hour from the time-zone offset value if the time you entered is on the “other side of the daylight time boundary”. Finally, click “Ok” to get the new plot.
When you click on the “Specify time” radio button, StarChart stops the display from automatically being updated. Clicking on the “Now” radio button will set the time back to the current time and resume automatically updating the time fields and the chart.
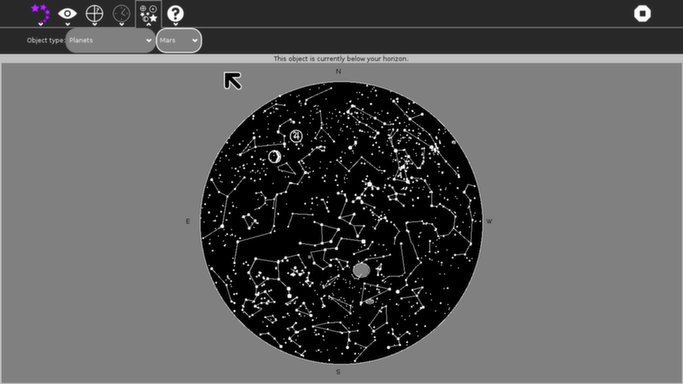
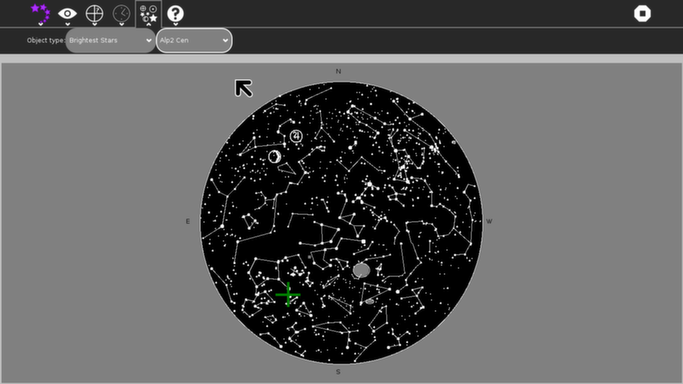
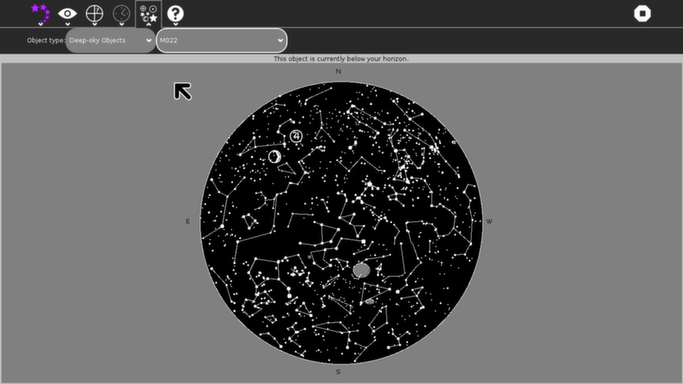
Locate 
These controls let you select an object and have it highlighted on the chart so you can tell where the object is in the sky. You can “locate” planets, stars (either by the constellation which contains the star or from a list of the brightest stars) or “deep-sky” objects.
- Planets
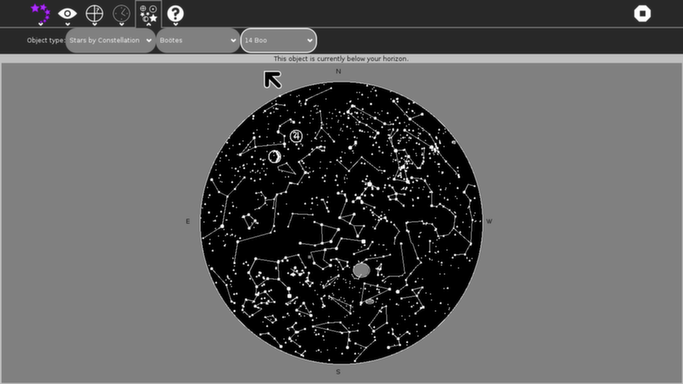
- Stars by Constellation
- Brightest Stars
- Deep-sky Objects
You begin by selecting the type of object. Then you pick the object itself...
Select from the list and sub-lists to locate whatever object you wish to.
Examples:
Reporting Bugs
To report a bug or to see what bugs have been reported and/or fixed, please go to the bug tracking page.